




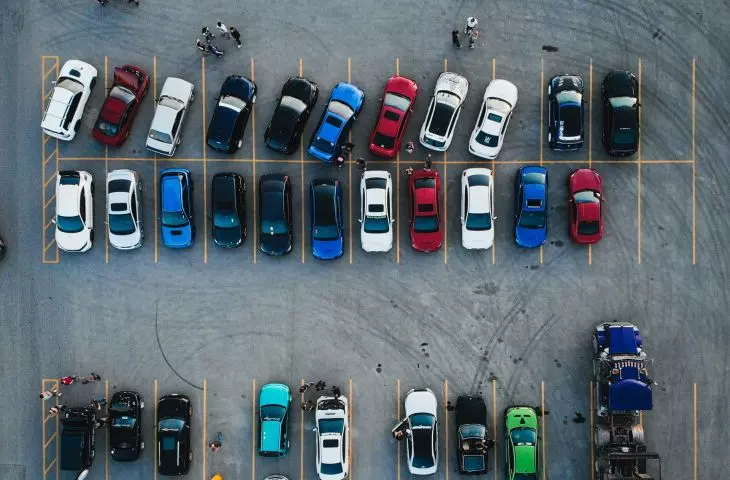
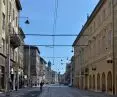

The pro-car narrative is gaining momentum with each passing day. Opposition is growing not only to city-wide regulations, as was the case with the protested Clean Transportation Zone in Krakow, but is also emerging in the context of more punitive changes being implemented in Polish cities. But are all residents entitled to a fair "allocation" of space? And how much space do cars really take up in our environment? The app created for the Cyclokoalicia association allows you to check this with concrete examples.
It is said that the city is for everyone. This is of course true, as long as under this statement we include not only young, athletic men, but also the elderly, children and young people, women, or people belonging to sexual minorities or burdened with various disabilities. In a city for all, both the economically privileged and the less well-off should feel good, regardless of origin, language or skin color. Also regardless of how they move through its streets and what mode of transportation they choose to do so.
This is an argument raised both by car enthusiasts trying to maintain the status quo, and by those advocating a more attentive look at the needs of pedestrians. If one were to listen to the exhortations of the former, keeping in mind the accessibility paradigm, one would have to ask: do our cities equally endow those moving on four wheels, as well as cyclists and pedestrians?
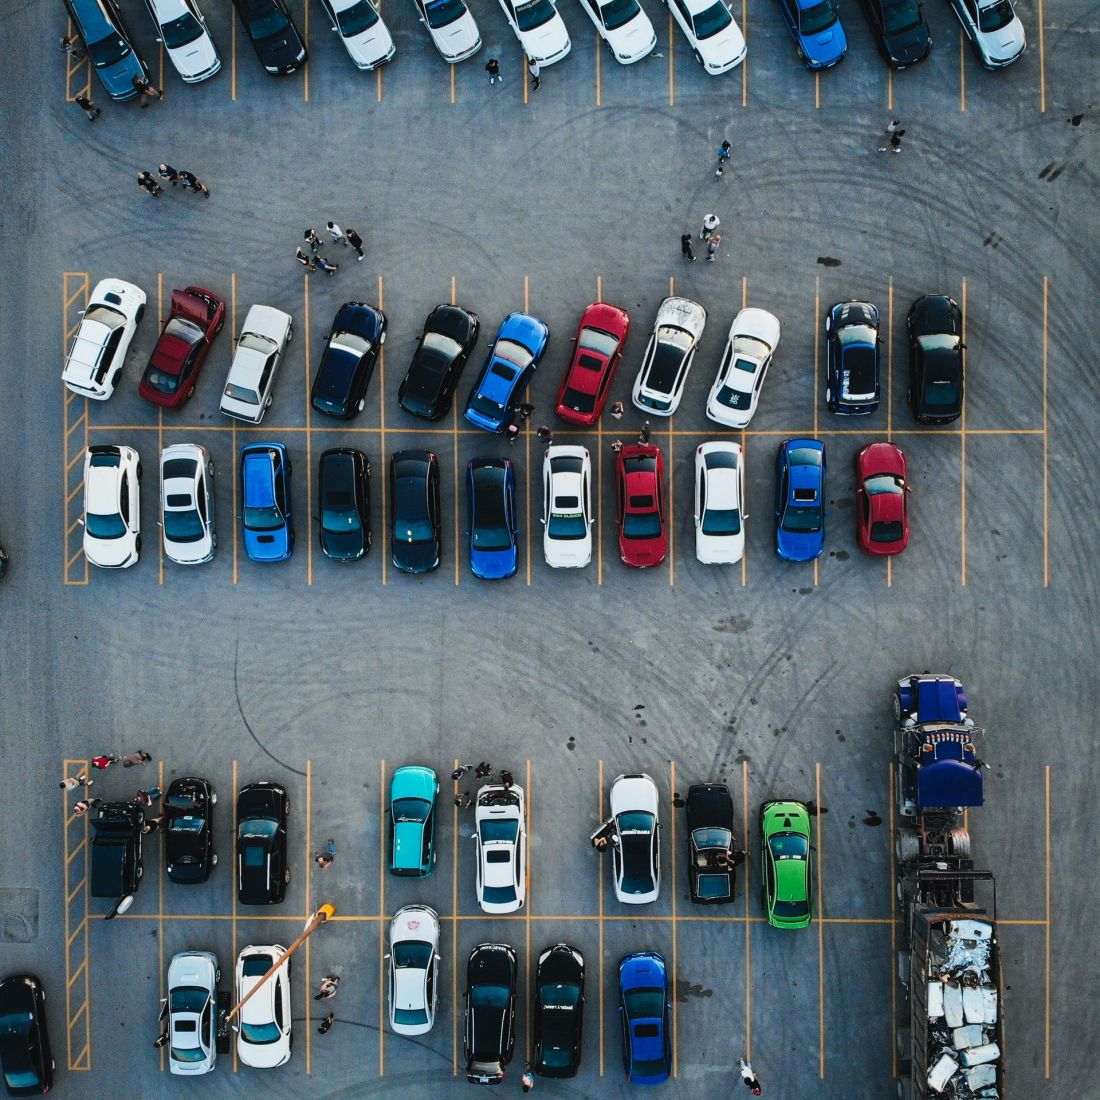
photo: m © Unsplash Free
How much space do cars take up in our cities?
There is a lack of pan-European or national reports that would unequivocally answer the question of how much of the streets in our cities are occupied by automobile infrastructure, how much greenery, bicycle paths and how much is left for pedestrians. Instead, there are case studies conducted for individual cities in Europe. For example, in Paris, 27 percent of the city's area is dedicated to transportation, more than half of which is occupied by automobile infrastructure [1]. The statistics are similar in Freiburg, where transportation consumes 19 percent of the area, and roadways and parking spaces account for as much as 55 percent of that space [2].
As always, the basis for a fair assessment of the situation remains context. After all, urban spaces serve different functions, and some may be more important than others in a given location. There's nothing unkind about the landscape of a suburban ring road, where pedestrian and bicycle paths occupy only a small part of the space, mostly intended for cars. The situation should be different in residential areas or service-oriented neighborhoods or in strict city centers. Are we able to study the division of urban space between different modes of transportation on a micro-scale?
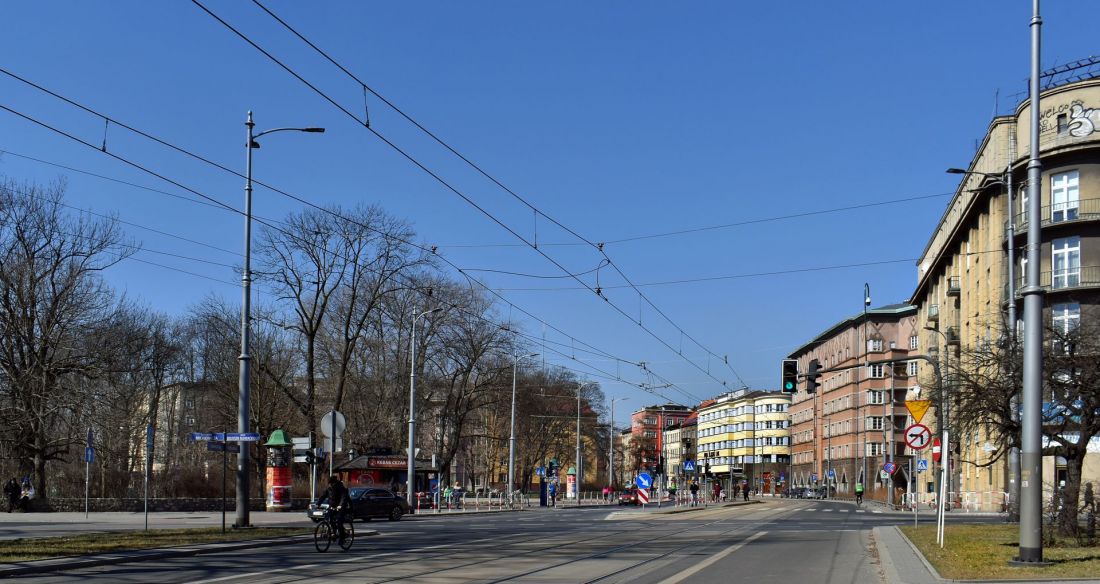
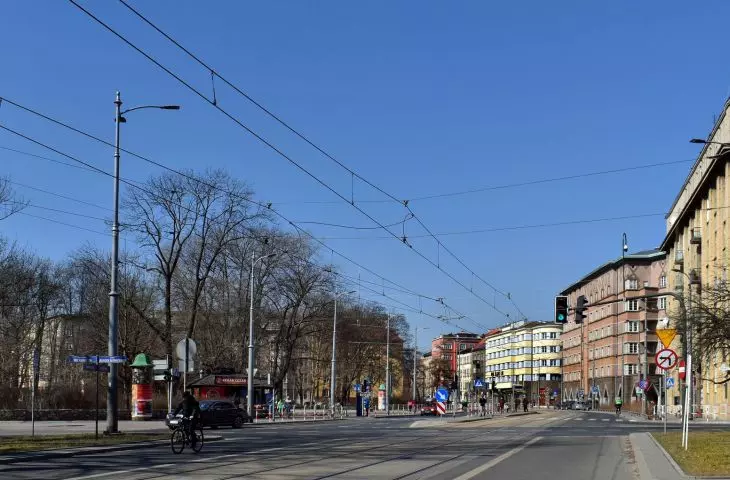
Inwalidów Square in Cracow
Photo: Zygmunt Put © CC BY-SA 4.0 | Wikimedia Commons
The arrogance of space
Cyklokoalicia, a Slovakian association of cycling enthusiasts, has released The Arrogance of Space Mapping Tool, a digital tool developed by Mikael Colville-Andersen and Daniel Duris. The simple application allows us to graphically delineate space serving cars, bicycle and pedestrian traffic, as well as public transportation, buildings, greenery and wasteland, based on a pre-loaded photograph showing a selected section of the city from a bird's eye view. After applying the data, we get an approximate percentage for each of the above categories. How does this look in the case of Krakow?
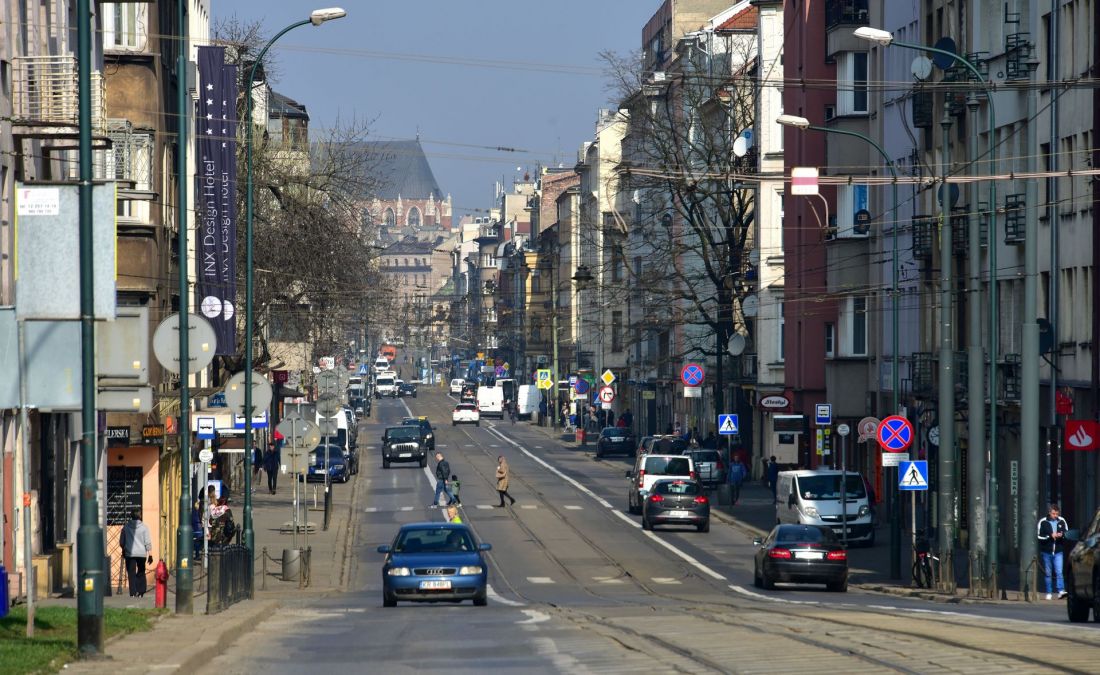
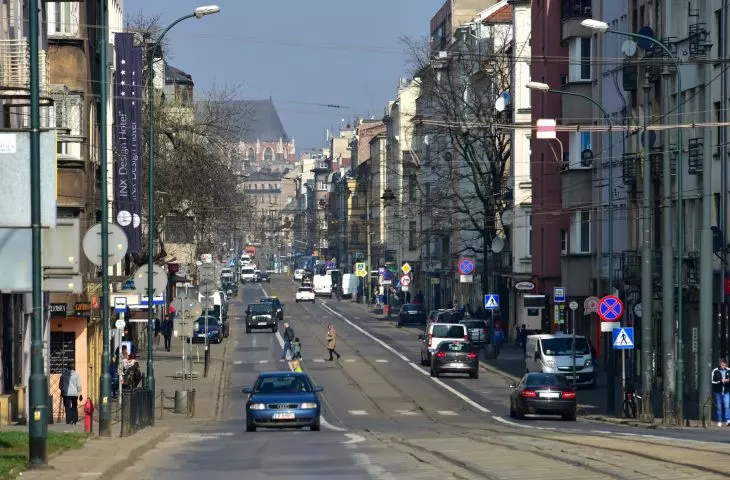
Starowislna Street in Krakow
Photo: Adrian Grycuk © CC BY-SA 3.0 en | Wikimedia Commons
direction: Starowiślna
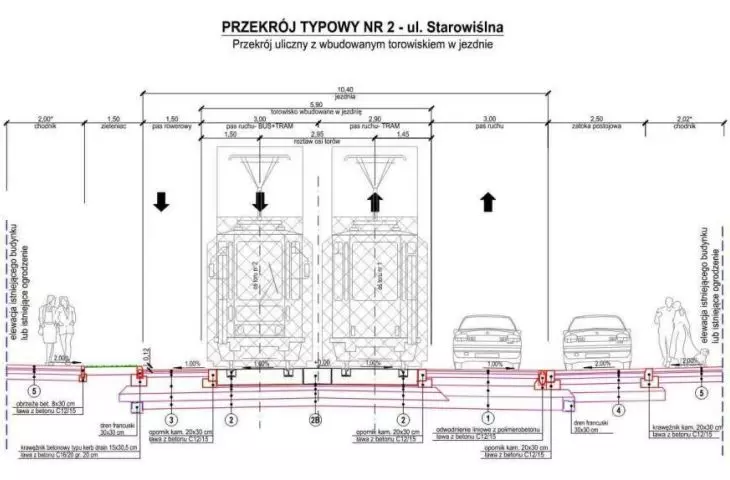
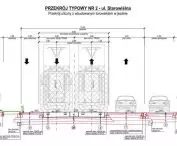
On March 24, 2026, the Krakow Council dismissed a second civic resolution aimed at blocking the renovation of Starowiślna Street in Krakow in its planned form. Starowiślna, after renovation, would become a one-way street with plenty of greenery, wide sidewalks and separate lanes for public transport and cyclists. Opponents of the planned changes fear a traffic jam on the street, and consequently on other city arteries, they also raise the issue of problems with access to properties and a reduction in the number of parking spaces.
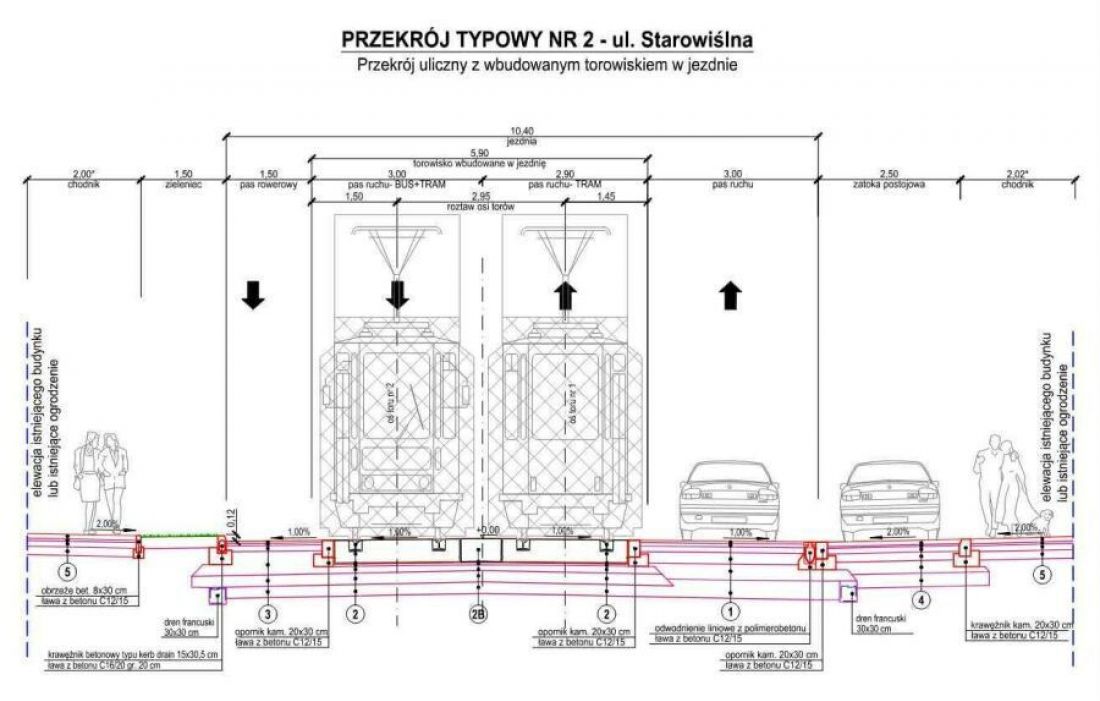
Planned traffic organization after renovation on Starowislna Street in Krakow
© mat. UMK
Currently, we are not able to fit all the functions that should be on a contemporary street there, so we have to strive for a compromise, but also determine priorities. The priority should be streetcars, for which we need to ensure smooth passage (which excludes car traffic on the tracks) and pedestrian traffic. After all, Starowislna is a downtown commercial street, and it is pedestrians who benefit from the services it offers. It is also one of the main pedestrian routes from the Old Town to Kazimierz. On top of that, the issue of bicycle traffic must be taken into account, as well as greenery and parking spaces, for example for supply vehicles.
- said Pawel Halat of the Coalition of Krakow Movements "Together for the City."
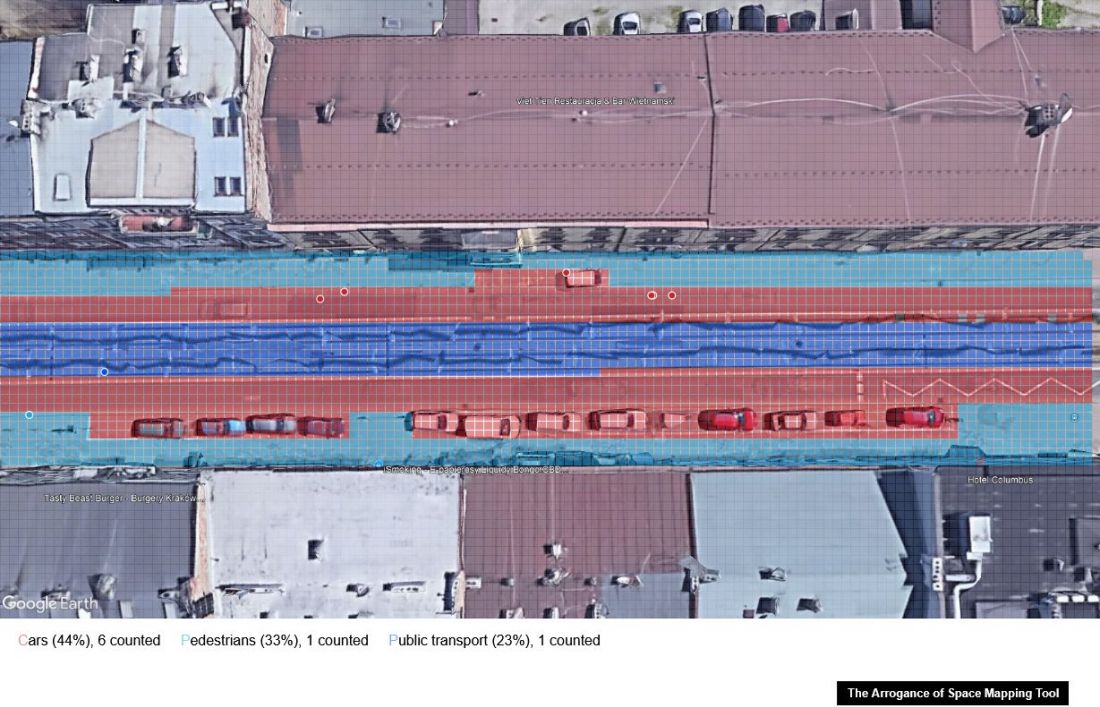
Most of the space on Starowislna Street is taken up by car traffic
Pedestrians versus cars in the center of Krakow
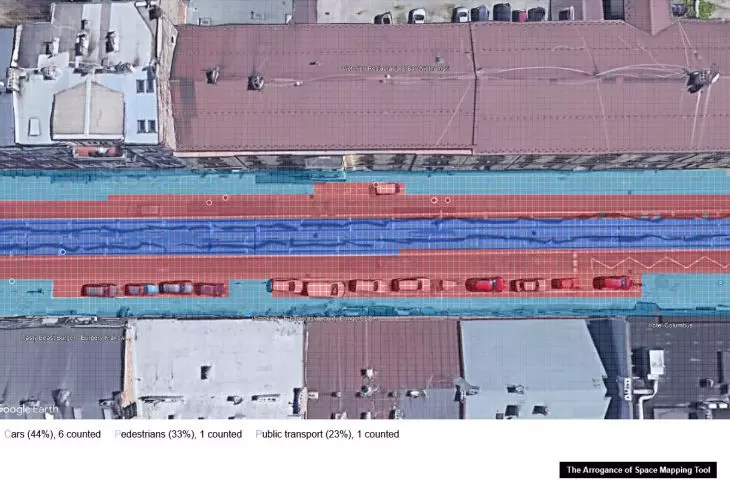
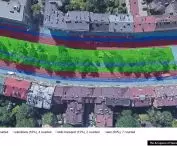
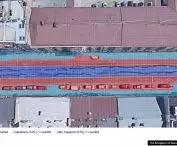
And what does Starowiślna Street look like in numbers? A quick analysis of a selected section of Starowiślna Street between Berka Joselewicza and Miodowa streets shows that it is the infrastructure serving cars (roadways and parking spaces) that takes up the most space. For private cars, 44 percent of the area of Starowislna Street works. The figure for public transportation is 23 percent, while pedestrians are left with only 1/3 of the street's width. It is worth noting at the same time that the lane intended for public transport is also used by private cars, for example, to evade or change direction. Greenery on the above section occupies a round 0 percent of the area.
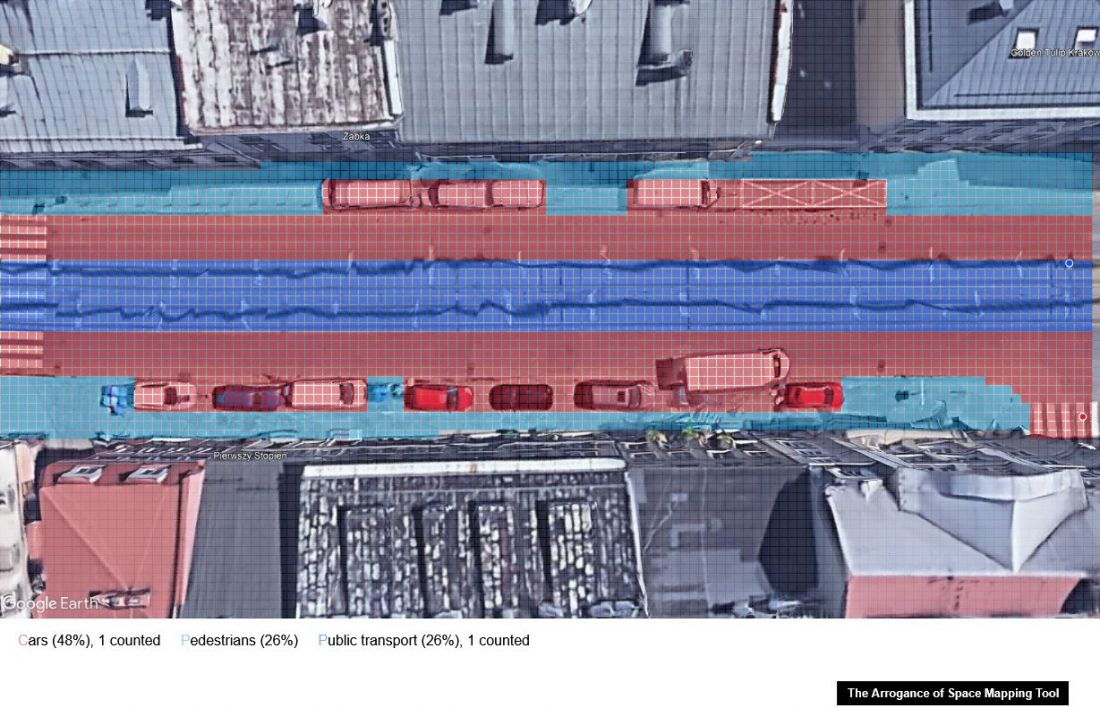
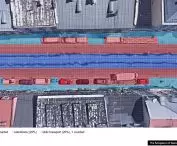
Analysis of the distribution of space on Krakowska Street using The Arrogance of Space Mapping Tool
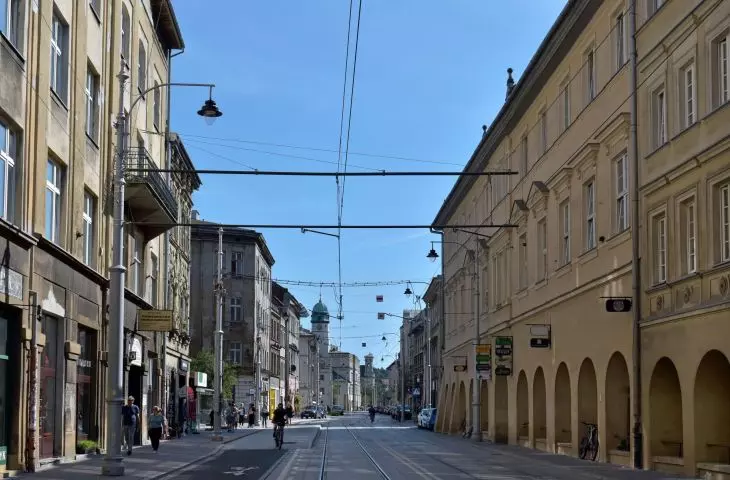
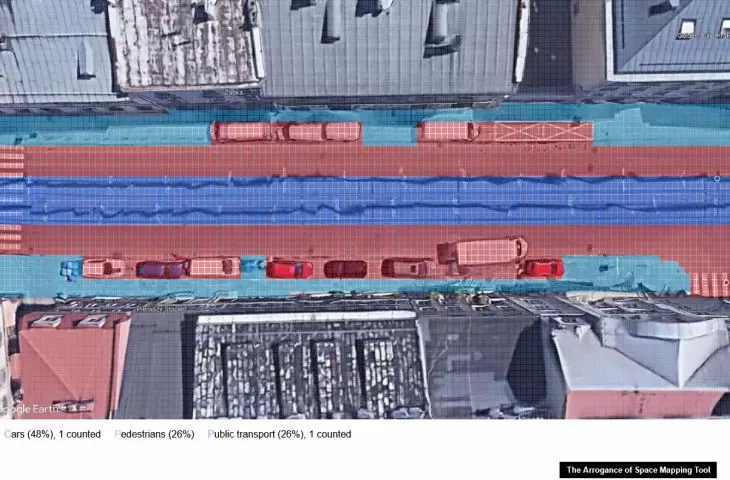
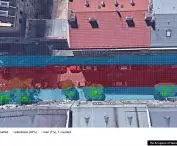
The situation is even worse on Krakowska Street, like Starowislna Street, which connects Kazimierz with the Old Town - in this case, carriageways for cars occupy 48% of the street's surface, while public transport lanes and pedestrian routes each take up 26%.
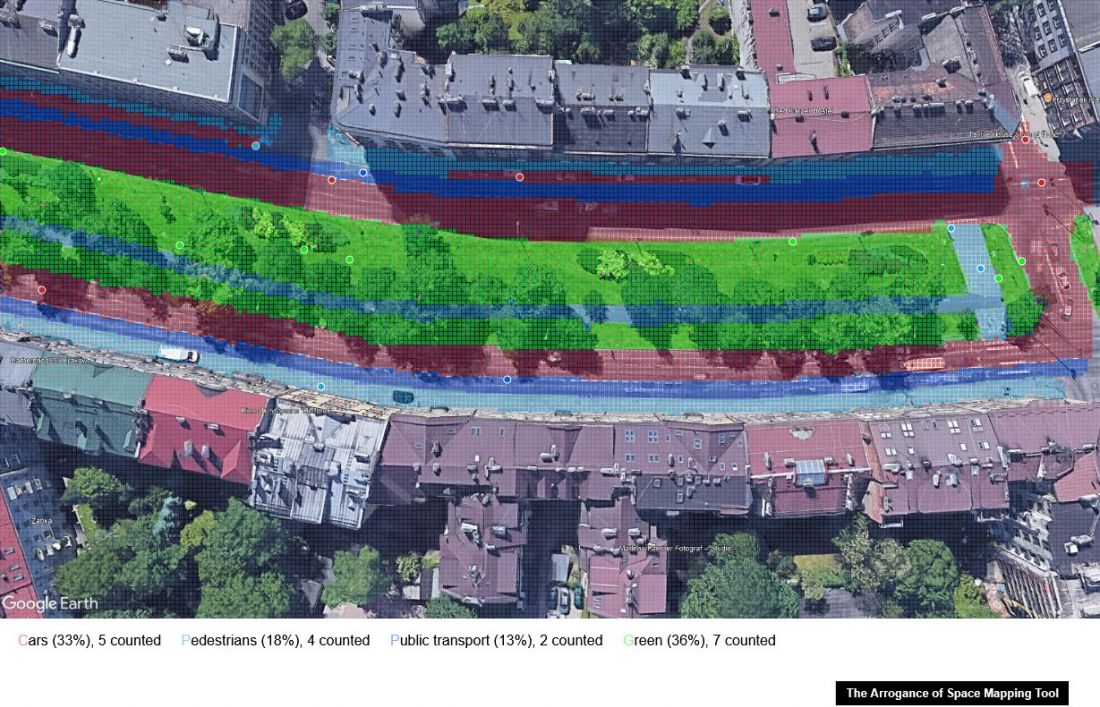
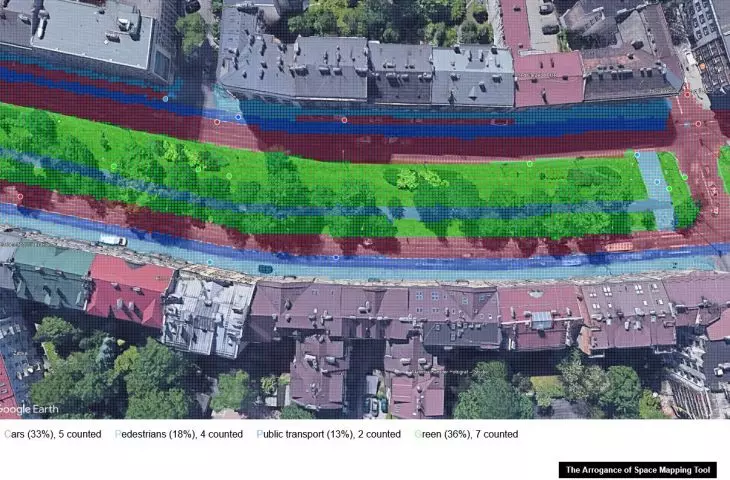
On a selected section of Juliusz Słowacki Avenue, pedestrian routes occupy only 17% of the space.
Things are no better on Aleje Trzech Wieszczów. For example, the selected section of Juliusz Słowacki Avenue has 36% green space, as much as 33% of the roadway dedicated to cars, 13% of bus lanes and only 18% of sidewalks and alleys.
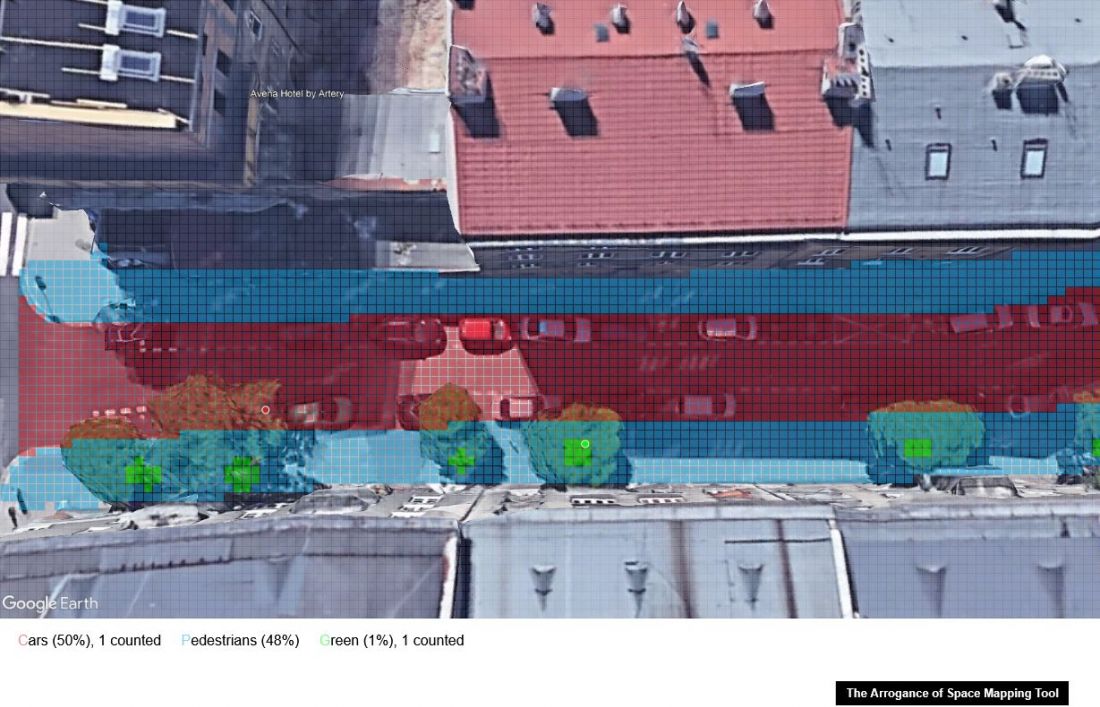
Comparison of the width of roadways and pedestrian routes on Jerzy Zulawski Street
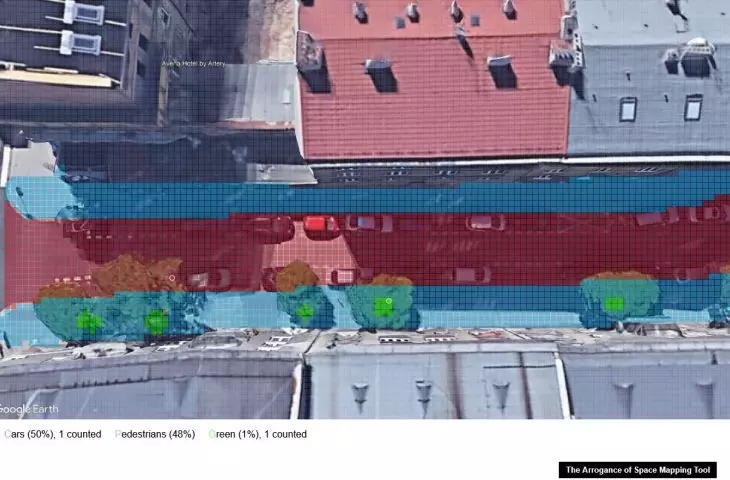
Only side streets offer any balance - for example, in the initial section of George Zulawski Street, the ratio of "car" space roughly corresponds to the area of pedestrian routes.
A drop in the sea of cars
This state of affairs is a natural consequence of the promotion of car traffic in city centers. According to various statistics, a private car is used on average for 9 hours a week, which means that it occupies a parking space for more than 90% of the remaining time [3]. Cars also take up much more space per person, compared to other modes of transport.
And it's only going to get worse - according to the European organization Transport & Environment , cars in our cities are growing by an average of half a centimeter a year [4]. Changing the character of Starowislna Street in Krakow, therefore, seems to be only a drop in the ocean of needs, and the purpose of similar actions is not to "make life difficult for drivers". - it is about creating friendly, clean and safe cities, taking care of the needs of all their residents.
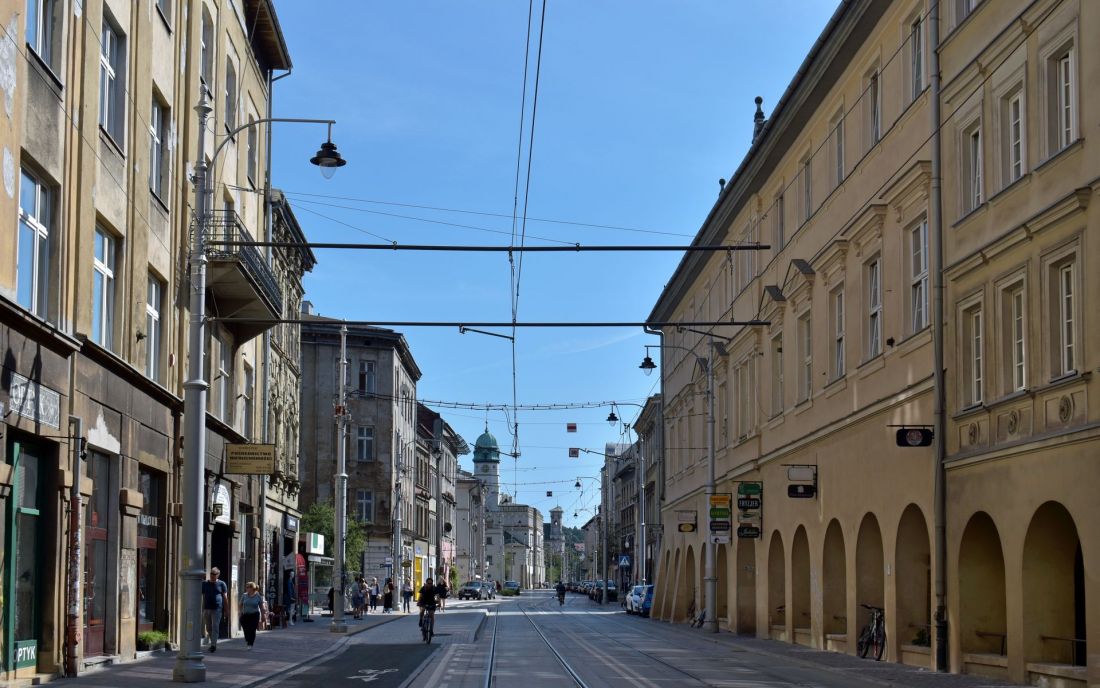
Krakowska Street in Krakow
Photo: Zygmunt Put © CC BY-SA 4.0 | Wikimedia Commons
eyewitness examples
The application provided by the Cyclokoalicia association should by no means be taken as a "serious" urban planning tool - the results obtained may vary depending on the selected photo and how it is interpreted, the perspective shortcut and the density of the measurement grid. This does not mean, however, that the data obtained with it are worthless. At a time when we perceive most information with our sense of sight, pictorial methods of presenting data are memorable for longer and affect our imagination more strongly compared to knowledge conveyed in the form of numbers or drawings. Especially if we can relate them to the specific spaces we inhabit, traverse or drive through every day. Are all their users treated equally?
Przemysław Ciępka
[1] F. Heran, E. Ravalet, La consommation d "espace-temps des divers modes de déplacement en milieu urbain Application au cas de l "Ile de France, 2008, p. 99.
[2] M. Schröder, P. Späth, T. Freytag, " Urban Space Distribution and Sustainable Transport," Transport Reviews, vol. 36, issue 15, 2016, pp. 659-679.
[3] https://www.independent.co.uk/news/uk/home-news/car-owners-motoring-time-behind-wheel-hours-week-study-survey-a8620336.html
[4] https://www.transportenvironment.org/articles/cars-are-getting-1-cm-wider-every-two-years-research